One of the strategic goals of the Safe Mobility for Life Coalition is to lead, implement, and evaluate coalition resources and activities using a proactive data-driven approach. At its core, we use data to drive our decisions, prioritize our attention and resources, and monitor if we are making progress to reduce the number of fatalities and serious injuries involving Floridians age 65 and older.
On an annual basis, the Coalition obtains official close-out data on crashes, population, and licensing to develop meaningful trends. This data is used to establish priority counties that also support our decisions as we implement the Safe Mobility for Life Strategic Action Plan.
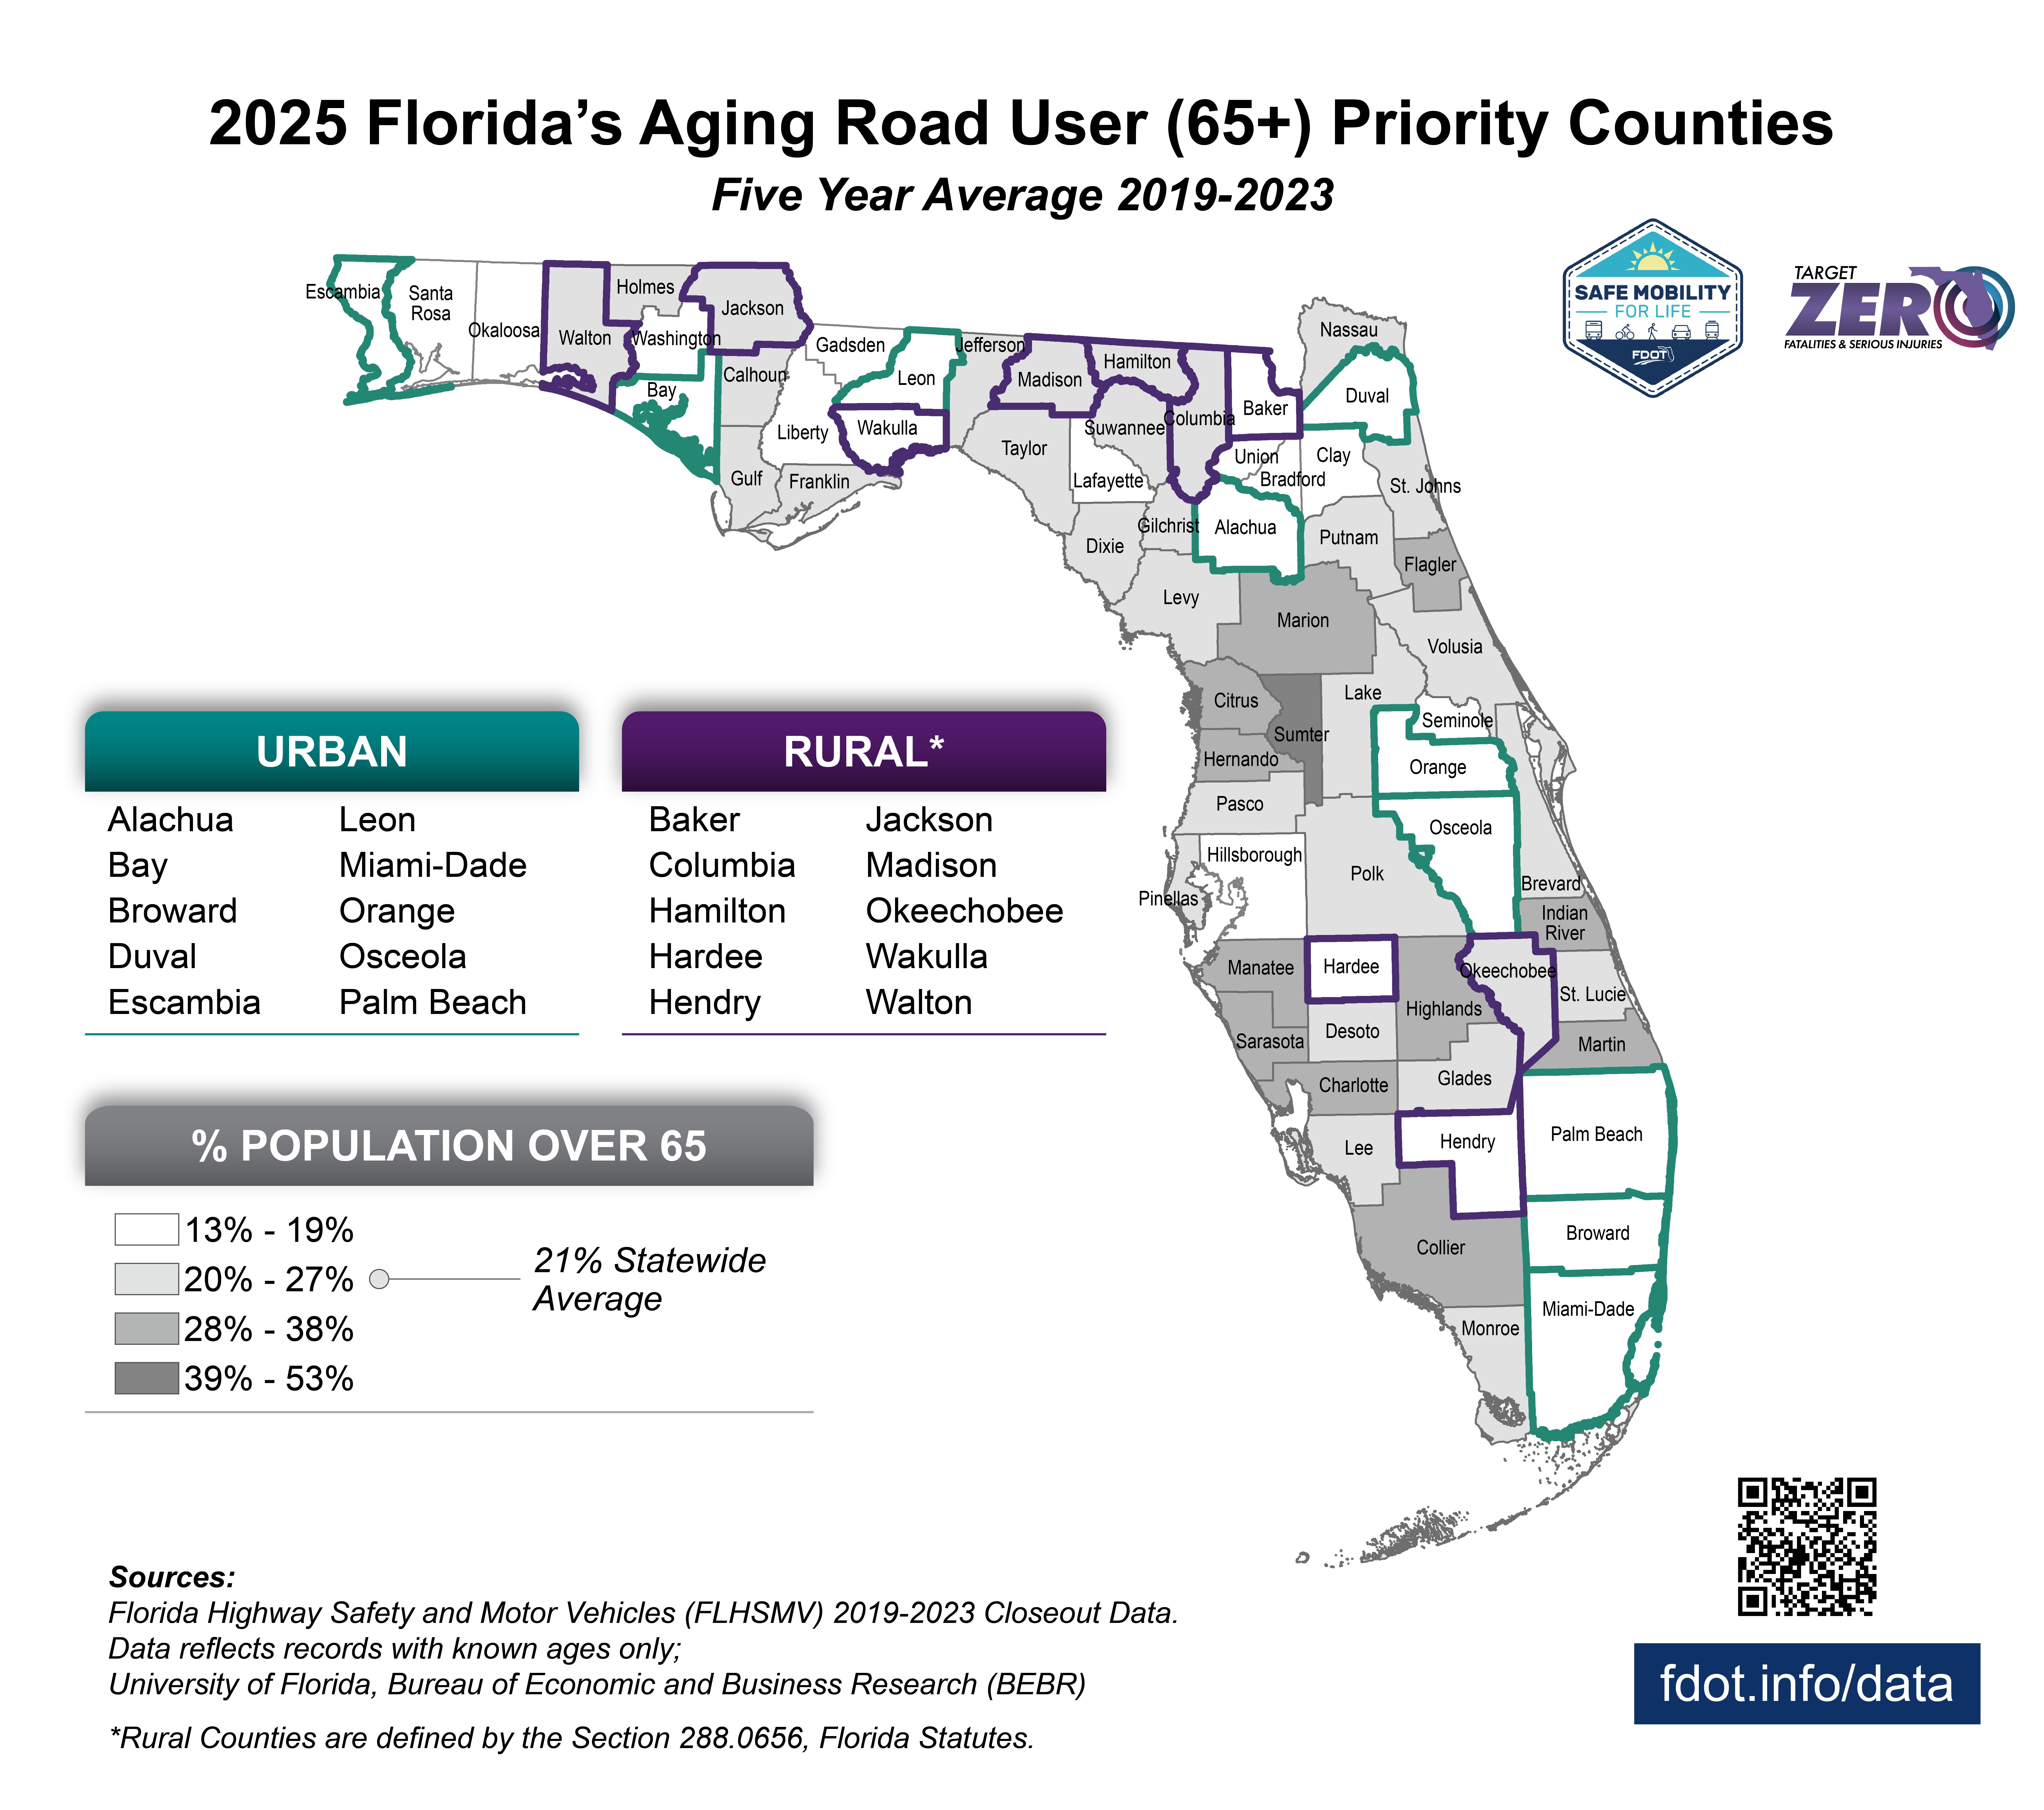
Priority Counties
To provide consistency when monitoring trends from year to year, the Coalition established a methodology to help identify priority counties where crashes involving aging road users may be over-represented relative to the county’s 65 year and older population. Every year, we apply this methodology by using a 5-year average of the rate of crashes involving individuals aged 65+ compared to the population of 65+ in both urban and rural counties.
Click Here to Access the latest Priority Counties Data
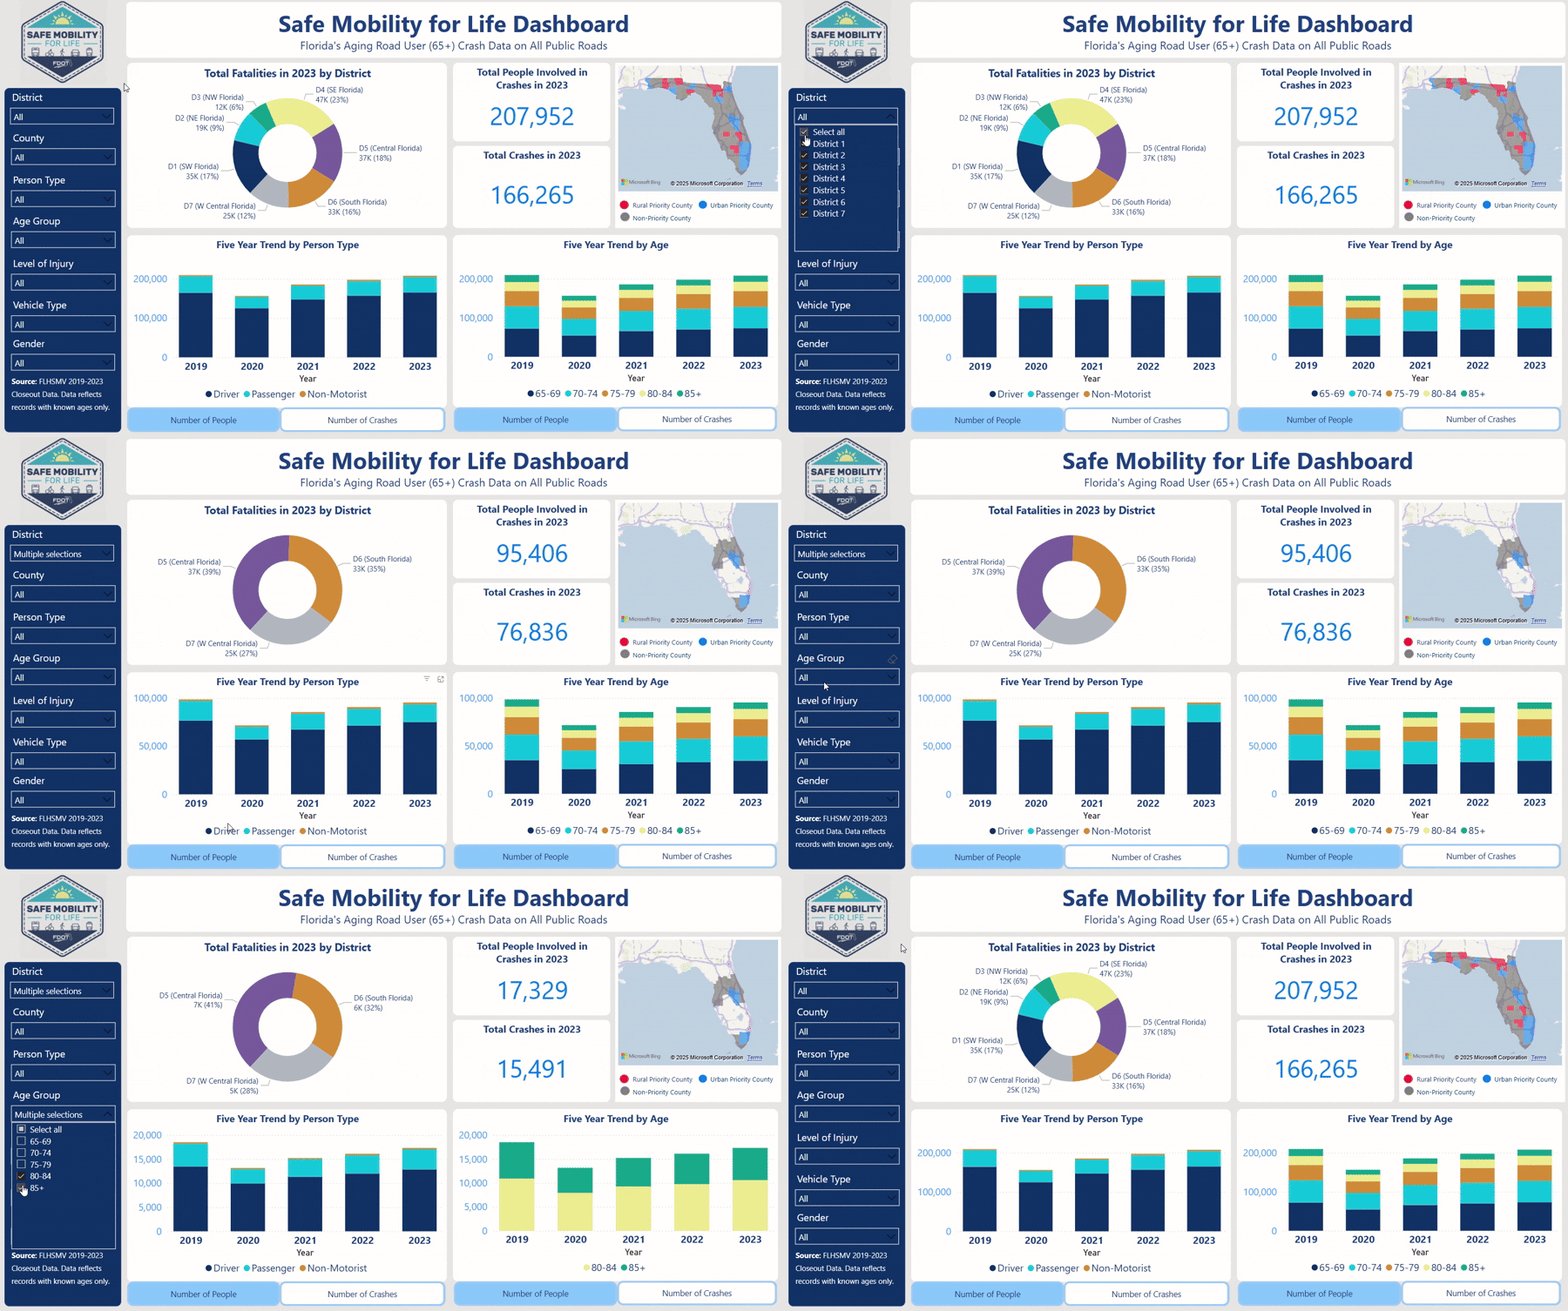
Dashboard
The Safe Mobility for Life Dashboard helps us visualize and analyze crash data for Florida’s aging road users (age 65+) across multiple dimensions, including FDOT Districts, county, age group, and level of injury. The Dashboard will be updated annually and reflects the five most recent end-of-year snapshots1 from the Florida Highway Safety and Motor Vehicles (FLHSMV). The data contains crash information on all public roads, and the Coalition processes it to filter crashes with known ages. The Dashboard can also be viewed on the FDOT Traffic Engineering and Operations Office (TEOO) Data Integration Space.

1. The end-of-year snapshots is the data used by FLHSMV for its official crash facts reports. The coalition uses the data that feeds the five most recent FLHSMV Crash Facts Reports

Data Sources
The following data sources are used to establish, analyze, and report on the Safe Mobility for Life Coalition's aging road user data:
- FLHSMV Crash Report data snapshot. This data is gathered from the Florida Department of Highway Safety and Motor Vehicles (FLHSMV) and is extracted and stored by the FDOT State Safety Office. The data extract occurs each year before the end of the year and includes the previous year’s data.
-
Signal Four Analytics (S4).
This is an integrated platform for online GIS-based crash analysis, with support for data download for users. The primary data source for crash data is the Florida Department of Highway Safety and Motor Vehicles (FLHSMV) and the source for citation data is the Florida Court Clerks Comptrollers (FCCC).
- BEBR Population Estimates.
The University of Florida’s Bureau of Economic and Business Research (BEBR) is the official source for Florida’s population statistics. The population projections, broken down by age, sex, and Florida counties, are used to develop various age-related statistics.
- FLHSMV Driver Licensed data. Like the population data, driver licensing data is broken down by age, sex, and county and is used to develop age-related statistics on the number of licensed drivers in the State.
For additional data resources that support Florida's Strategic Highway
Safety Plan, visit
FDOT's Safety Engineering webpage.
Frequently Asked Questions
What are the benefits of using Safe Mobility for Life Dashboard to enhance aging road user safety?![]()
- The Safe Mobility for Life Dashboard enables user to visualize aging road user (65+) crash data trend of most recent five years, broken down by following categories to support the Coalition’s proactive, data-driven approach of eliminating fatalities and reducing serious injuries.
- FDOT Districts
- County
- Person type (i.e. driver, non-motorist, passenger)
- Age group (i.e. 65 to 69, 70-74, 75-79, 80-84, 85+)
- Level of injury (i.e. fatalities, serious injuries)
- Vehicle type, and
- Gender
- The Dashboard also allows users to visualize the aging road user crash trends by urban and rural priority counties identified by the Coalition.
Where can I find more detailed crash data?![]()
- For more detailed information, there are several resources available for exploration:
- eTraffic – Safe Mobility for Life tab
- Signal Four Analytics
- Safety Data Integration Space (only available to FDOT staff)
- FDOT Safety Office’s Safety Engineering
Sources: FLHSMV Closeout Data (data reflects records with known ages only), BEBR Population Estimates, FLHSMV Licensed Driver Data.
No Warranties: This site and its content is made available by the Florida Department of Transportation on an "as is", "as available" basis without warranties of any kind, express or implied.
Disclaimer of Liability: The user of this application and data assumes all responsibility and risk for the use of both. Under no circumstances, including negligence, shall the Florida Department of Transportation, or its employees be liable for any DIRECT, INDIRECT, INCIDENTAL, SPECIAL, EXEMPLARY or CONSEQUENTIAL DAMAGES, or LOST PROFITS that result from the use, misuse or inability to use the application and data. Nor shall the Florida Department of Transportation, or its employees be liable for any damages resulting from or related to reliance; mistakes, omissions, interruptions, deletion of files, computer viruses, errors, defects, or any failure of performance, communications failure, theft, destruction or unauthorized access to the application and data.
